

Data is now at the heart of everything we do.
Used judiciously, it can give you key insights into how to plan for the future, drive projects, position your company, and assess your performance with ever-greater accuracy. Data opens up a world of new opportunities. But beware—getting to grips with huge amounts of complex data is a tricky business.
Data is incredibly valuable for training. L&D teams monitor data and take performance indicators directly from it. But beyond that, what should we be analyzing? And how? How can we select and sort the right sources of data to create useful training dashboards?
Choose your comparative data carefully
When it comes to training, comparing yourself with other companies can be a losing game. You don’t need to be in first place; you need to be in the right place for your company. Dashboards help pinpoint how well your learners understand what training is available, how much they know about it, and what they think about it.
When looking at several companies, choose your filters carefully. Just because you can compare absolutely everything, it doesn’t mean that you should . But there is one thing you must do: be clear about the Who, What, and How.
Who? [Filters]
Similar organizations in terms of:
- Company size
- Business
- Digital experience
- International footprint
- Learning culture
- Specialism
- Skillset
- Average age of employees
What?
- Quantitative data (e.g., completion rate)
- Qualitative data (e.g., satisfaction rate)
- Financial data (e.g., hourly costs, impact on production)
- Formats (e.g., Blended)
Expert tip: Use at least three different filters for a three-dimensional view tailored to your business.
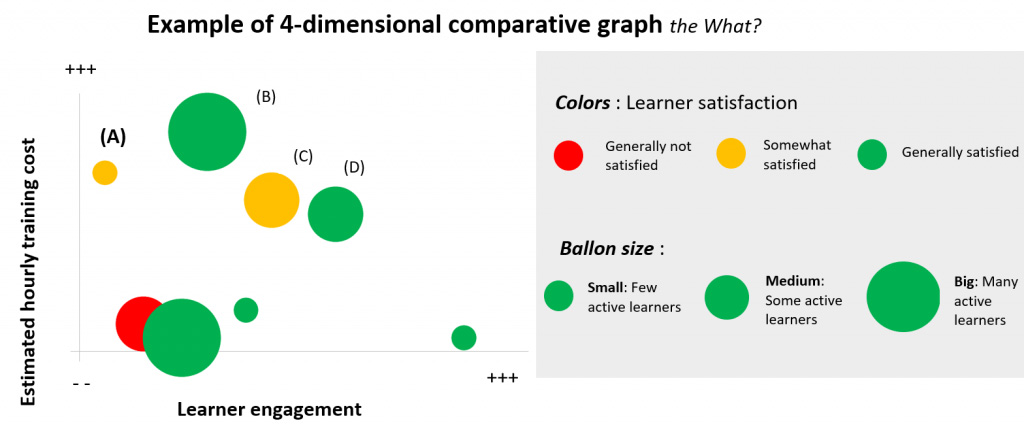
This type of graph, developed by and for CrossKnowledge, compares one company (A) with its competitors. Company (A) has a fairly high hourly training cost, a low learner retention rate, an average learner satisfaction level, and a relatively low activity level. You can use this initial comparative study to benchmark your company (or department) in relation to others.
Remember: Look carefully at the context!
Use an action plan to guide how you work
Now that you have a macro vision, think about your ideal position. Where in the graph would you like to be? What changes do you want to make in your company? Based on your analyses and experience, you can plot how you might get there and draft an action plan to move from point A to point B.
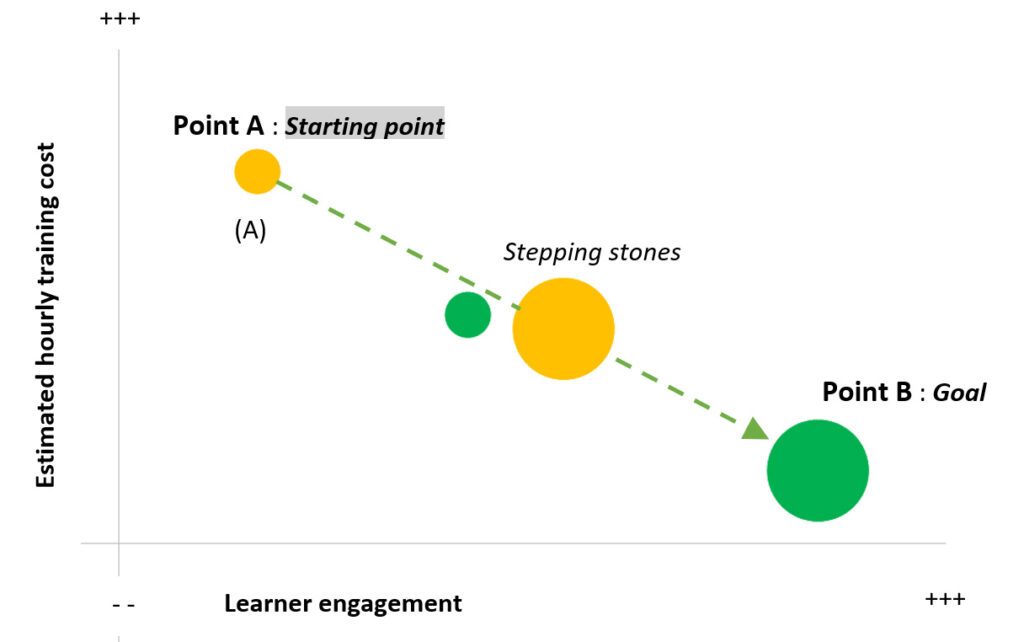
The company depicted above has implemented a two-year action plan (including one analysis every six months) based on four goals:
- Improve learner satisfaction (color changes from orange to green)
- Increase the number of active learners (the size of the balloon increases)
- Increase learner retention (the balloon moves to the right)
- Decrease the average hourly cost of training (the balloon drops down the y-axis)
Plotting hypothetical scenarios to help draft an action plan. Are there any specific recommendations?
Proceed with caution because misinterpreting data can lead you down a dead-end street. To stay on track, you must consider 4 key areas:
- Accessibility (both in terms of content and technology)
Is the training on offer accessible to a particular group?
⇒ Consider technical or functional improvements.
e.g., SSO links - Visibility
Have your team members been fully informed about the training platform?
⇒ Optimize your platform ergonomically and communicate internally, especially with managers.
e.g., Home page, integration with your systems and intranet - Motivation
Are learners motivated and keen enough to complete the course?
⇒ Make the training system attractive using learner marketing techniques (for example, get company leaders to champion the project).
e.g., Cultural relevance, link to an event - Recommendations
To what extent do your learners recommend content and training pathways to their peers? Do they feel that the training was useful?
⇒ Pay particular attention to the teaching quality and expertise.
e.g., Satisfaction score, loyalty rate
⇒ Confirm by collecting their feedback.
e.g., “End of course surveys”, on-the-spot questionnaires
Your plan should cover all the ways you wish to improve performance. Treat each goal separately, or tackle them at once should one affect the others.
To conclude, why do you need a training dashboard ?
You need a training dashboard to manage your training environment, but it won’t have all the answers without your input. You have to provide the right data depending on your challenges and goals, and they analyze this data methodically. The dashboard will help you position yourself and make your training more impactful. But even when you’ve done everything you can, you may still need some help.
Now that you know more about how to analyze and monitor the effectiveness of your training courses, it’s time to think about what impact they have.